
 Possessing significant security and legal expertise to choose the safest versions
Maintaining ecosystem security insights about new risks affecting projects
Tracking an average of 1,500 dependency changes per year per project
Possessing significant security and legal expertise to choose the safest versions
Maintaining ecosystem security insights about new risks affecting projects
Tracking an average of 1,500 dependency changes per year per project
Sifting through thousands of projects to pick the best ones
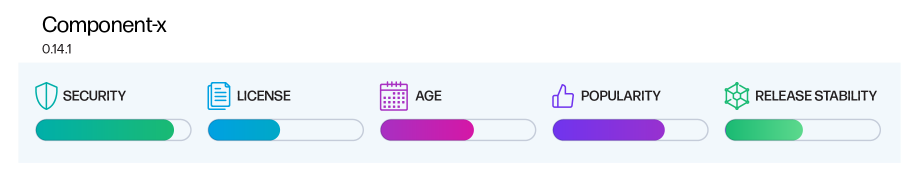
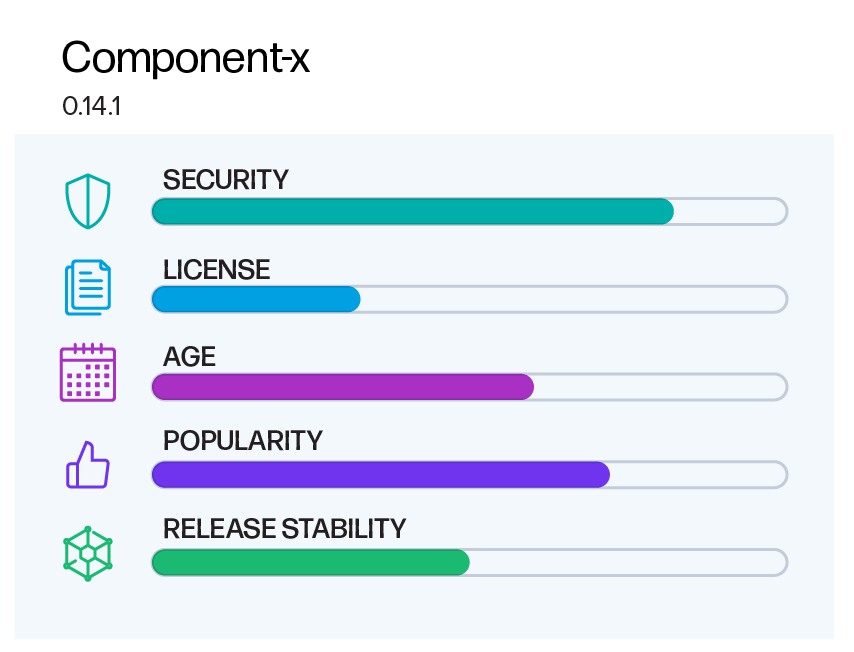
Potential challenges impacting component choice
 POPULARITY
When deciding which dependencies to use in a development project, popularity is often used as a proxy for quality (i.e., "everyone else is using it, so it must be safe, secure, and reliable"). Theoretically, this makes sense as more popular projects should be getting fixed faster. But they aren't. As revealed in our 2019 State of the Software Supply Chain report, the popularity of a dependency does not correlate with a faster median update time. Developers may feel safe in selecting more popular projects, but just because a dependency is popular, doesn't necessarily mean it's "better."
 CLARITY
Oftentimes, developers aren't manually selecting individual versions when building software supply chains and those dependencies are already part of a project that's being used or built upon. As cited in the 2020 State of the Software Supply Chain report, 80-90% of modern applications consist of open source software. If an SBOM and proper DevSecOps practices are not implemented, developers and software engineering teams may have no way of knowing that those vulnerable components are being used, pulled, or built upon.
 AUTOMATION
Although there are plenty of open source automation tools, very few have security capabilities built in. Similar to the Clarity issue above, this automation may mask potential vulnerable dependencies, enabling developers to unknowingly build upon projects with known vulnerabilities.
 INACTIVE RELEASES
There are almost 500,000 projects within Maven Central, but only ~74,000 of those projects are actively used. That means 85% of projects are sitting in this repository and taking up space, potentially overwhelming developers with available options.
Understanding component upgrade urgency
To better understand this cost, we looked into the concept of "upgrade urgency" to shed light on the need for a data-driven solution. Our approach is based on a component scoring algorithm, which not only scores a component but also categorizes its versions into distinct zones. These zones range from the best/optimal versions to reactive (worst) versions.
Proactively managing dependencies is of utmost importance because, as the saying goes, software ages like milk not wine. Remaining in a reactive state is not only suboptimal from a security perspective, but it also puts development teams at an immediate disadvantage and penalizes them when issues arise. Analyzing the observed patterns reveals that teams that proactively make upgrade decisions are in a significantly better position to make the most informed choices.
FIGURE 3.2. UPGRADE URGENCY
- 0 - Optimal version(s): Component scores in the top 10% of the best version’s score
- 1 - Proactive: Scores between the top 10% and 1 standard deviation below the max
- 2 - Borderline proactive: Scores 1 standard deviation below the max but less than 2 standard deviations
- 3 - Reactive: Scores 2 or more standard deviations below the best version for that component
We will apply these algorithms to explore download patterns across different urgency zones, providing valuable insights into how software development industry professionals are making their component selections and upgrade decisions.
Downloads by upgrade urgency
As you know, Maven Central is the de facto repository for Java-based open source libraries. It acts as a centralized hub, enabling developers to effortlessly discover, access, and integrate dependencies into their projects. Its widespread adoption and comprehensive collection of artifacts have made it an essential resource for Java developers worldwide.In our analysis, we used Maven Central to examine the download patterns of component versions. We looked at a typical month of data and determined the upgrade urgency of each download. In a perfect world, developers would only be downloading optimal versions of their dependencies in order to minimize risk and future upgrade effort.
With 2.6 billion downloads being classified as “borderline” and a further 1.1 billion falling into the worst (reactive) category, there is some cause for concern. After all, we live in a world where it only takes just one vulnerability to "set the internet on fire."
A ton of wasted time
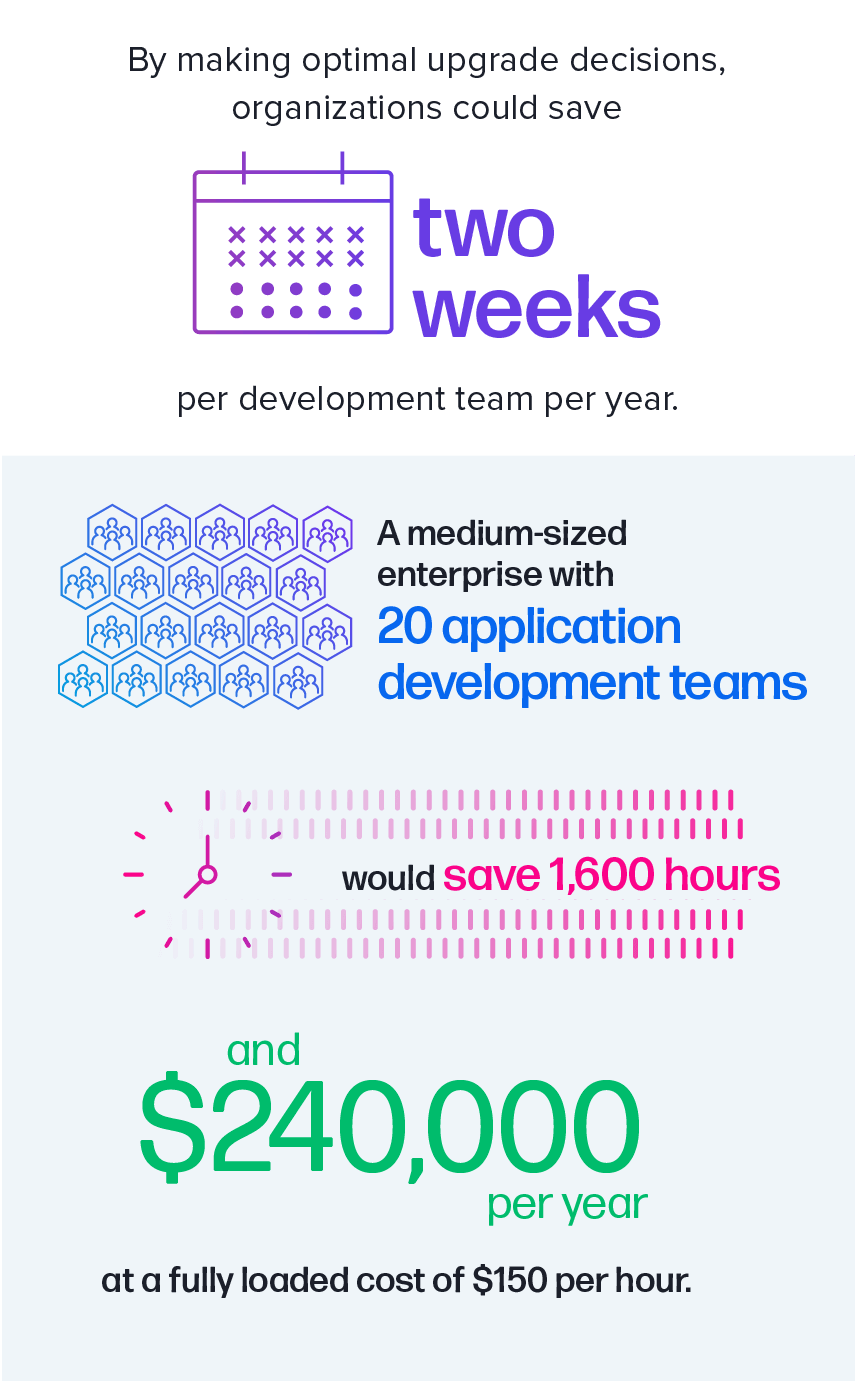
In prior years, we reported on how efficient timing for upgrades can yield significant cost savings. Opting for safer versions and prolonging their use can significantly reduce upgrade expenses. In a medium-sized enterprise with 20 development teams, the potential gain equates to two extra development weeks per application each year.
FIGURE 3.4. TIME SAVED WITH OPTIMAL UPGRADE DECISIONS
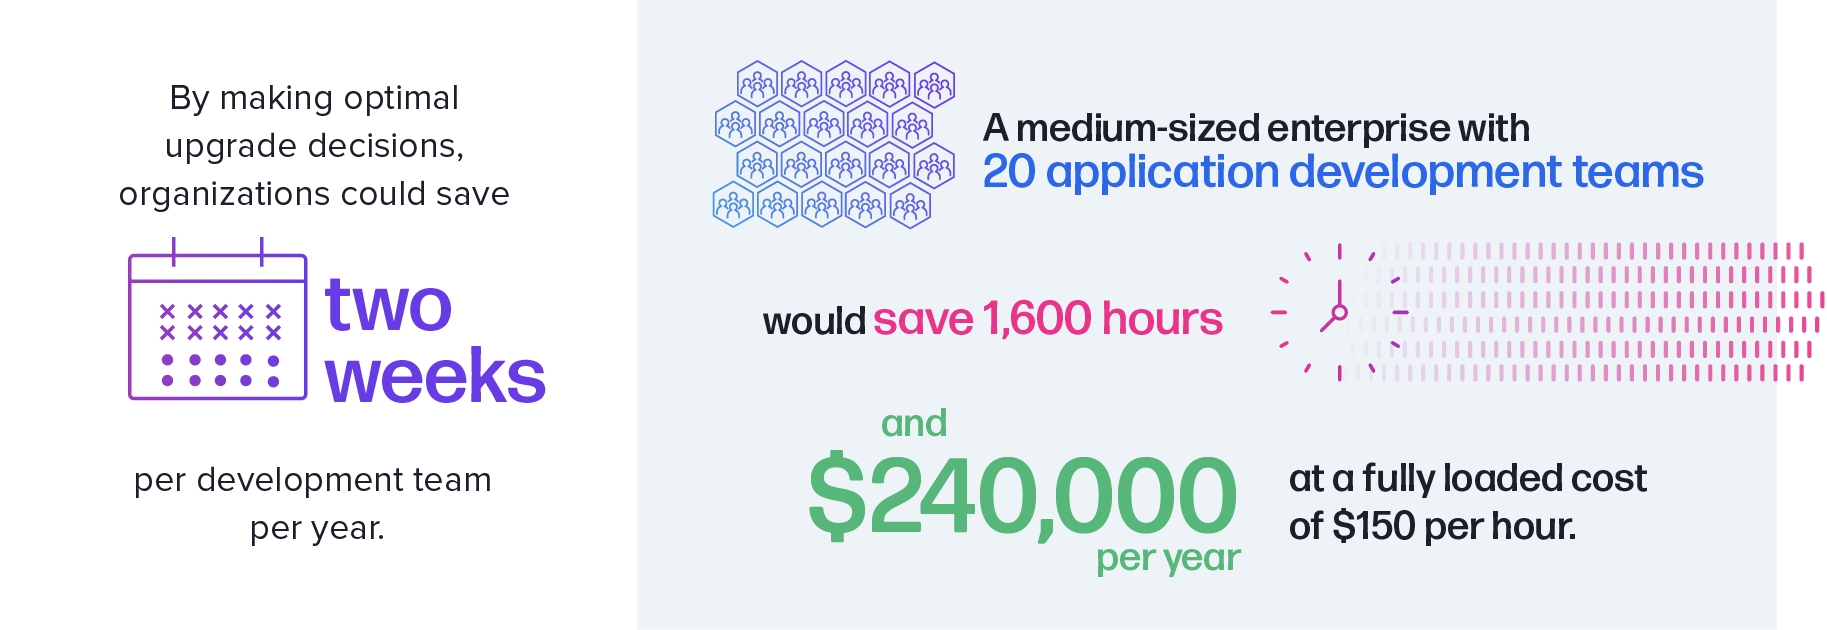
FIGURE 3.4. TIME SAVED WITH OPTIMAL UPGRADE DECISIONS
In answering this question, we found that when teams use better security data that reduce false positive findings by 25% in combination with making optimal upgrade decisions, each team saved a total 1.5 months of time per application, per year. This equates to a 2X boost in time saved over just the optimal upgrade process we described in our 8th annual State of the Software Supply Chain report last year. In other words, if you improve the security data you use and reduce false positives in tandem with upgrade efficiency, you double your gain.
In past years, we’ve looked at "optimal" as being a single component or a single version. There was a right and wrong version. This year, we’ve established that optimal is really a range. There is still a “right” or a “wrong” but on a spectrum. To further this, we examined the Maven Central Repository to quantify wasted developer time. In this scenario, we define wasted time as the download of an optimal version of a component when another optimal version of that same component has already been downloaded by that user instance. To put this into perspective, let’s again go back to our car analogy. Would you buy a car every time a new model year comes out? The optimal buying period might be when the model refreshes say every five years, rather than incremental changes each year. In our analysis, we consistently observed this phenomenon, which is all too frequent and raises concerns. The gains of such frequent upgrades are minimal, and from a lead/management perspective prioritization can also be optimized/aligned based on things that are in the optimal range versus just getting the new component.
However, we also noted great variability in this practice. To highlight this drawback we call attention to anonymized data from several companies in two different industries. We analyzed two organizations in the energy industry with a similar number of Maven Central downloads. Out of each company's total downloads, we found there was approximately 1.8 times more wasted downloads from one organization compared to the other.
The value of an artifact repository manager
In the scenario above, we know much of this wasted time could be solved by simply using a good repository manager, like Sonatype Nexus Repository Manager. A centralized, binary repository allows you to proxy, collect, and manage your dependencies so that you are not constantly juggling all of these various versions. Or, in this case, wasting time in downloading optimal versions, when another optimal version is already in your instance. It becomes the single source of truth for an organization’s software components and applications.

Global patterns of open source consumption behavior
In today's interconnected global landscape, various regional groupings and trade agreements play a pivotal role in shaping international relations, trade dynamics, and economic cooperation. We explored whether these groupings also inform software development in the form of component consumption patterns.With the component score, we can consider the quality of the component. With upgrade urgency, we can assess how good the downloaded version is. Bringing it all together, we examined global download patterns. We gave equal weight to component scoring and upgrade urgency. We gave a little additional weight to the sheer quantity of downloads, because picking the right components and staying on the best versions is surely harder at scale. Below are some observed global trends.
Software Supply Chain Maturity